Dosya:Beta distribution pdf.svg
Tam çözünürlük (SVG dosyası, sözde 531 × 425 piksel, dosya boyutu: 80 KB)


Özet

Açıklama
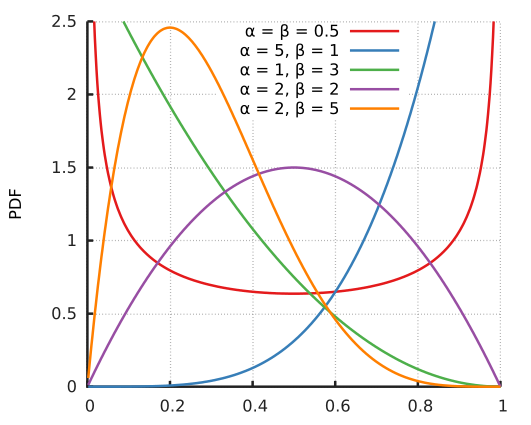
English: Probability density function for the Beta distribution. Created using Gnuplot.
Tarih
Kaynak Yükleyenin kendi çalışması
Yazar Horas based on the work of Krishnavedala
Diğer sürümler File:Beta_distribution_pdf.png
SVG gelişimi
InfoField
 
Bu SVG kaynak kodu geçerlidir.
 
Bu vektörel grafik Gnuplot ile oluşturuldu.
 
The file size of this SVG plot may be irrationally large because its text has been converted to paths inhibiting translations.
Kaynak kodu
InfoField

Gnuplot code

Source code
reset
reset session

out=2
outputpath= "./"
outputfilename="betadistribution"
if(out==1) {
	set terminal qt size 1000,750 font ",14"
}
if(out==2) {
	set terminal pdfcairo size 15cm,12cm  font ",20" linewidth 2
	set output outputpath.outputfilename.".pdf"
}
if(out==3) {
	set terminal pngcairo size 800,600  font ",14"
	set output  outputpath.outputfilename.".png"
}

dbeta(x,a,b) = exp((a-1)*log(x)+(b-1)*log(1-x)-lgamma(a)-lgamma(b)+lgamma(a+b))
pbeta(x,a,b) = ibeta(a,b,x)
f(x,y,z) = dbeta(x,y,z)

set samples 500
 
set xrange [0:1]
set xtics 0.2
set yrange [0:2.5]
set ytics 0.5

#set xlabel "x"
set ylabel "PDF"

set key at .78,2.5

set grid xtics ytics mytics lw 1 lc rgb "#888888" dashtype 3 lt 1
set border 3 back lw 2 lc rgb "#222222"
set tics in nomirror scale 0.75

lww=2
set ls 1 lw lww lc rgb "#e41a1c"
set ls 2 lw lww lc rgb "#377eb8"
set ls 3 lw lww lc rgb "#4daf4a"
set ls 4 lw lww lc rgb "#984ea3"
set ls 5 lw lww lc rgb "#ff7f00"

plot \
    f(x, 0.5,0.5) w l ls 1	title "{/Symbol a} = {/Symbol b} = 0.5", \
    f(x, 5,  1)   w l ls 2	title "{/Symbol a} = 5, {/Symbol b} = 1", \
    f(x, 1,  3)   w l ls 3	title "{/Symbol a} = 1, {/Symbol b} = 3", \
    f(x, 2,  2)   w l ls 4	title "{/Symbol a} = 2, {/Symbol b} = 2", \
    f(x, 2,  5)   w l ls 5	title "{/Symbol a} = 2, {/Symbol b} = 5"

if (out>1) {
	set output
}
if (out == 1) {
	pause -1

Data

Source code
from matplotlib.pyplot import *
from numpy import linspace
from scipy.stats import beta

x = linspace(0,1,75)

fig = figure()
ax = fig.add_subplot(111)
ax.plot(x,beta.pdf(x,0.5,0.5),label=r"$\alpha=\beta=0.5$")
ax.plot(x,beta.pdf(x,5,1),label=r"$\alpha=5, \beta=1$")
ax.plot(x,beta.pdf(x,1,3),label=r"$\alpha=1, \beta=3$")
ax.plot(x,beta.pdf(x,2,2),label=r"$\alpha=2, \beta=2$")
ax.plot(x,beta.pdf(x,2,5),label=r"$\alpha=2, \beta=5$")
ax.grid(True)
ax.minorticks_on()
ax.legend(loc=9)
setp(ax.get_legend().get_texts(),fontsize='small')
ax.set_ylim(0,2.6)
ax.set_xlabel("x")
ax.set_ylabel("PDF")

fig.savefig("Beta_distribution_pdf.svg",bbox_inches="tight",\
	pad_inches=.15)

Lisanslama

Bu çalışma telif hakkı için uygun değildir ve bu nedenle kamu malı kapsamındadır çünkü tamamen ortak mülkiyet ve orijinal yazarlık içermez.

Altyazılar

Bu dosyanın temsil ettiği şeyin tek satırlık açıklamasını ekleyin.

Bu dosyada gösterilen öğeler

betimlenen

14 Kasım 2014

image/svg+xml

de326fe46a16d6d3650e15c3fcb708853472be46

81.527 bayt

425 piksel

531 piksel

Dosya geçmişi

Dosyanın herhangi bir zamandaki hâli için ilgili tarih/saat kısmına tıklayın.

Tarih/SaatKüçük resimBoyutlarKullanıcıYorum
güncel13.10, 14 Kasım 201413.10, 14 Kasım 2014 tarihindeki sürümün küçültülmüş hâli531 × 425 (80 KB)Horas{{Information |Description={{en|1=Probability density function for the Beta distribution. Created using the following code: reset reset session out=2 outputpath= "./" outputfilename="betadistribution" if(out==1) {...
21.45, 4 Haziran 201121.45, 4 Haziran 2011 tarihindeki sürümün küçültülmüş hâli639 × 489 (68 KB)Krishnavedala{{Information |Description ={{en|1=Probability density function for the Beta distribution. Created using python with matplotlib, scipy and numpy toolboxes. <syntaxhighlight lang="

Bu görüntü dosyasına bağlantısı olan sayfalar:

Küresel dosya kullanımı

Aşağıdaki diğer vikiler bu dosyayı kullanır:

Meta veri